Decile 10 areas are the most deprived areas in New Zealand.
In the 2018 deprivation index, decile 10 areas are concentrated in Northland, Gisborne, Eastern Bay of Plenty and Northern Hawke’s Bay. At the other end of the spectrum, decile one areas are the least deprived areas, these areas are generally concentrated in and around New Zealand’s major urban areas (Dunedin, Christchurch, Wellington, Hamilton, Tauranga and Auckland).
In December 2019, the University of Otago released their 2018 deprivation index for New Zealand. This deprivation index, similar to the 2013 and 2006 versions, makes use of recently released Census data to split all of New Zealand statistical areas into 10 deciles.
What is the purpose of the deprivation index?
The aim of the NZ deprivation index research programme is to develop indexes of socioeconomic deprivation for New Zealand, to support and inform:
- Application in funding formulas
- Research in especially health and other social services. For example, in the health sector, many researchers use the indexes to describe the relationship between socioeconomic deprivation and health outcomes
- Community groups and community-based service providers to describe the populations they serve, and to advocate for extra resources for community-based services.
What is included in the deprivation index?
For the 2018 version of the deprivation index, the University of Otago has replaced the variable “access to a car” used in the 2013 version, with “living in homes with severe damp and/or mould”. Otherwise the variable used to create the 2013 and 2018 deprivation indexes remained the same. The nine variables included in the 2018 deprivation index are as follows:
- People aged 18-64 receiving a means tested benefit
- People living in households with equivalised income below an income threshold
- People with no access to the Internet at home
- People aged 18-64 without any qualifications
- People aged <65 living in a single parent family
- People not living in own home
- People living in household with equivalised bedroom occupancy threshold
- People aged 18-64 unemployed
- People living in dwellings that are always damp and/or always have mould greater than A4 size.
The largest change between the 2013 and 2018 versions of the deprivation index is the geographic unit used. In 2013 the deprivation index was determined at the mesh block and census area unit levels. Since then Statistics New Zealand has moved to using a new geographic breakdown of New Zealand which uses the geographic units Statistical Area 1 and Statistical Area 2. Statistical Area 2 are effectively a like for like replacement of the previous census area units, while Statistical Area 1 are smaller geographic areas, which are comprised of one or more of the previous mesh blocks.
A further, more minor change, was for the variable 'people with no access to the Internet at home'. In 2013, this variable was restricted to those under 65 years. In 2018, the age restriction was removed because the Internet and Internet access has become increasingly necessary for everyday activities like trading, banking, and interacting with government departments.
What are the results telling us?
The deprivation index maps of New Zealand for 2018 and 2013 are included below. Areas within decile one are the least deprived, and are generally concentrated in and around New Zealand’s major urban areas (Dunedin, Christchurch, Wellington, Hamilton, Tauranga and Auckland) in both 2018 and 2013. Though pockets of decile 10 areas do exist in these cities, examples of this include Mangere, Glen Innes and Manukau in Auckland, and Cannons Creek and Naenae in Wellington. This indicates that the greater employment, housing and education opportunities which exist in larger cities do not mean that areas of great socioeconomic deprivation do not exist within them.
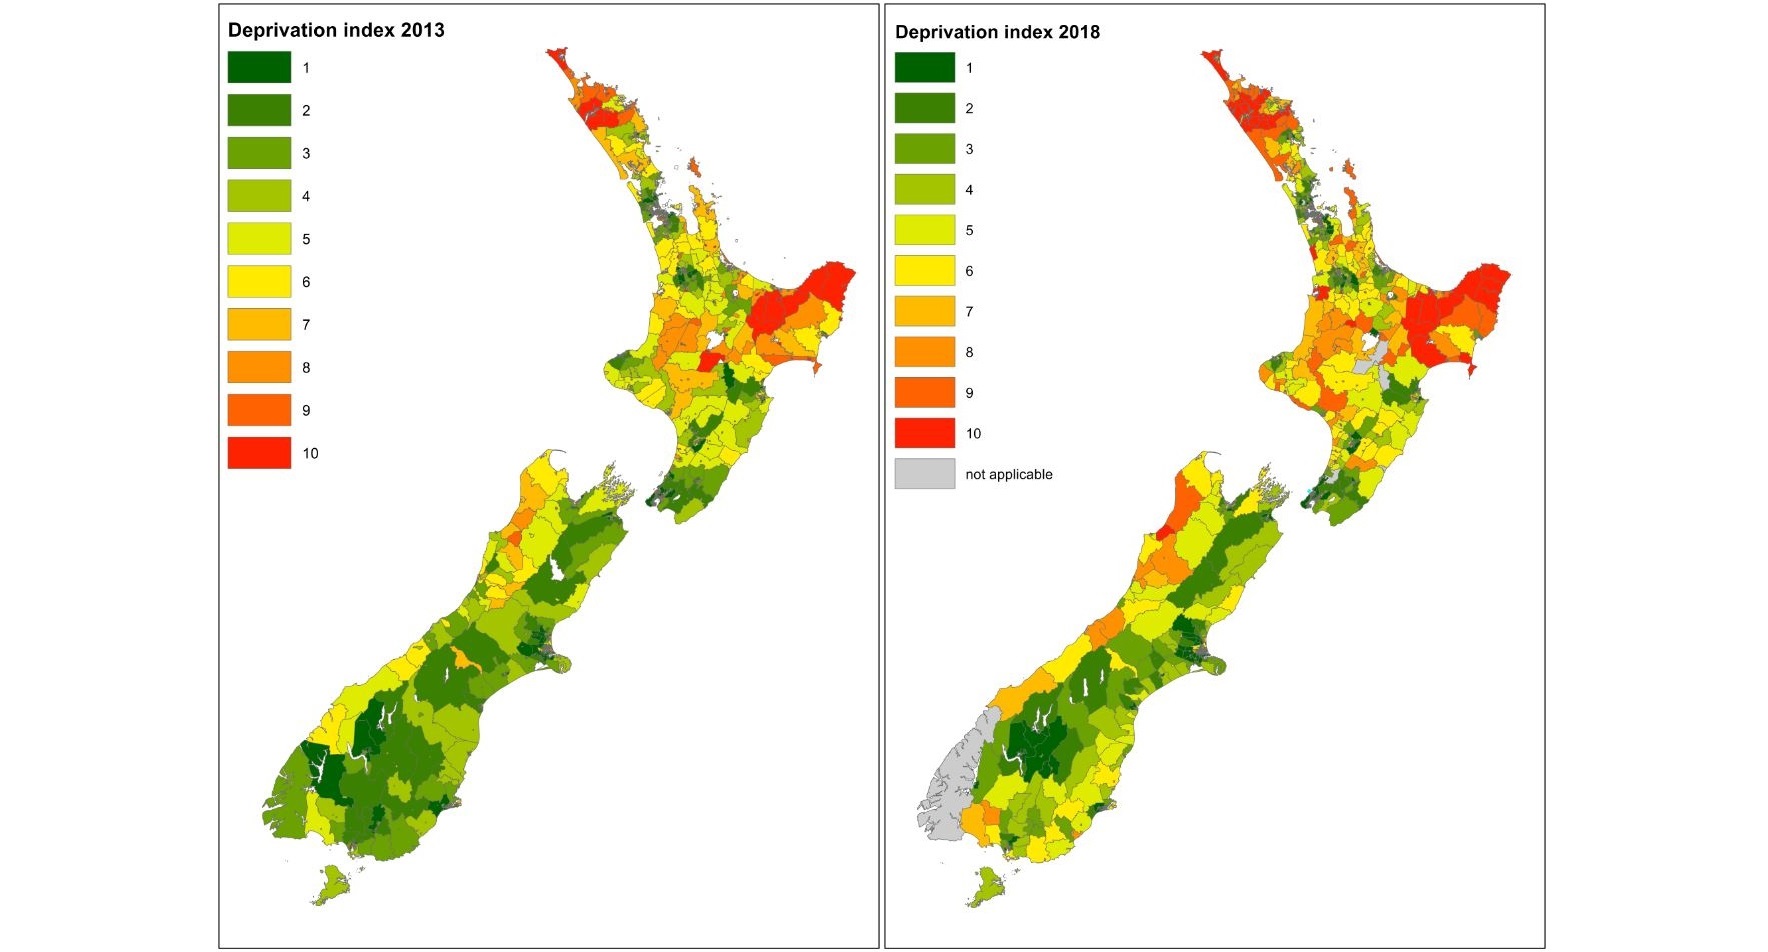
Areas within decile 10 are the most deprived, in both 2018 and 2013 these areas are concentrated in Northland, Gisborne, Eastern Bay of Plenty and Northern Hawke’s Bay. Given the variables used in the deprivation index calculations it indicates that more jobs, housing, education, and services are required in these areas in orders to ease the socioeconomic deprivation present in these areas.