10 years on from the GFC
01. What's been happening since 2008?
It has now been 10 years since the 2008 Global Financial Crisis (GFC) and therefore an excellent time to review how New Zealand’s labour market and economy have performed since the peak of the GFC. To examine New Zealand’s performance over the last 10 years we will look at what pace New Zealand’s employment and GDP numbers grew? was this growth evenly spread across all regions? and what industries were leading the growth?
In total New Zealand saw a decline in GDP in both 2009 and 2010, with the loss sitting at around $3b in GDP. At the same time total employment fell by almost 28,000 FTEs between 2009 and 2010. As can be seen in the figure below that employment and GDP quickly recovered in New Zealand in 2011 and both employment and GDP totals were higher in 2012 than they were in 2008.
Since the start of the GFC in 2008 New Zealand has seen the addition of 376,440 FTEs which equates to 1.9 percent per annum employment growth, in addition New Zealand has added $53.85 billion in GDP in 2018 dollars which equates to growth of 2.1 percent per annum growth.
Given that New Zealand population has increased from 4.1 million in 2008 to almost 4.7 million 2018, the increase in GDP has seen New Zealand’s GDP per capita increase from $56,700 in 2008 to $61,250 in 2018.
02. Where has this growth in employment occurred?

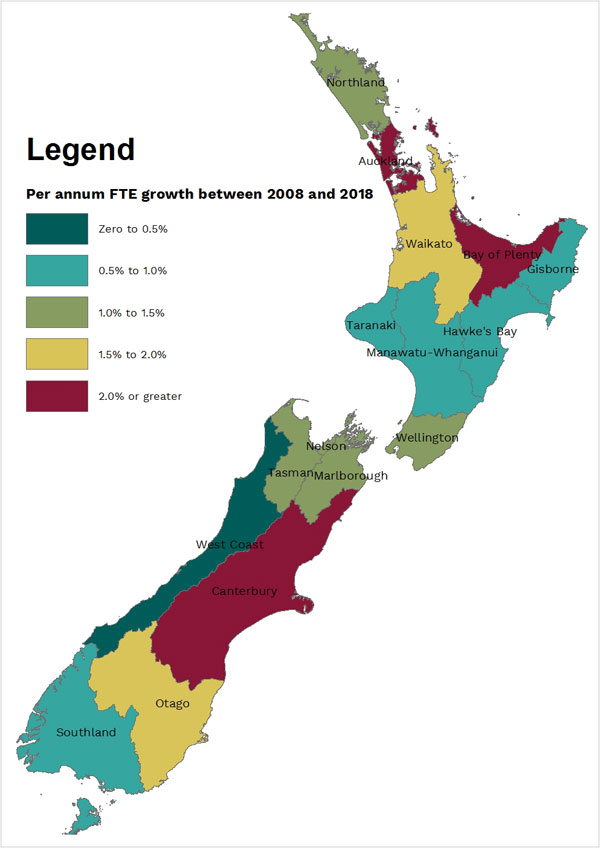
The largest per annum percentage increases have occurred in the Auckland region, with the region growing over the last 10 years by 2.7 percent per annum. At the same time Canterbury has seen employment grow by just over two percent per annum over the last 10 years. For the Auckland region much of its job creation has been fuelled by strong immigration with the majority of new immigrants to New Zealand settling in Auckland. For Canterbury, employment growth has been driven largely by the rebuild efforts after the 2011 and 2012 Earthquakes.
At the other end the West Coast region (0.1 percent per annum), Southland region (0.6 percent per annum), and the Gisborne region (0.6 percent per annum) have seen much slower growth in employment.
Moving away from per annum growth and examining the total percentage growth in employment in each region reveals that in comparison to the overall New Zealand growth, Canterbury, Bay or Plenty and Auckland were the only regions to grow faster. This is shown in the figure below.
03. Which industries have been fuelling this growth?
In terms of growth in employment the top 10 industries driving New Zealand’s growth in employment are shown in the table below. It is interesting to note that all of the top 10 are service based industries, of which eight have been fuelled primarily by New Zealand’s strong population growth.
Overall these 10 industries averaged 3.7 percent per annum growth in FTE numbers.
| Industry | Employment (FTEs) | ||
|---|---|---|---|
| 2008 | 2018 | %pa growth | |
| Professional, Scientific and Technical Services | 11,321 | 152,172 | 2.8 |
| Construction Services | 91,730 | 126,152 | 3.2 |
| Preschool and School Education | 83,161 | 118,580 | 3.2 |
| Food and Beverage Services | 74,132 | 105,987 | 3.6 |
| Hospitals | 51,559 | 78,655 | 4.3 |
| Administrative Services | 59,833 | 79,636 | 2.9 |
| Public Administration | 51,525 | 70,965 | 3.3 |
| Medical and Other Health Care Services | 45,538 | 64,600 | 3.6 |
| Computer System Design and Related Services | 19,688 | 36,148 | 6.3 |
| Residential Care Services | 31,125 | 46,115 | 4.0 |
Overall 21 of the 86 main industries that encapsulate the New Zealand economy have experienced a decline in employment over the last 10 years. Industries in decline over this period included textile manufacturing; printing; primary metal and metal product manufacturing; store-based retailing; publishing excluding internet and music publishing; and furniture manufacturing.
04. Where has this growth in GDP occurred?

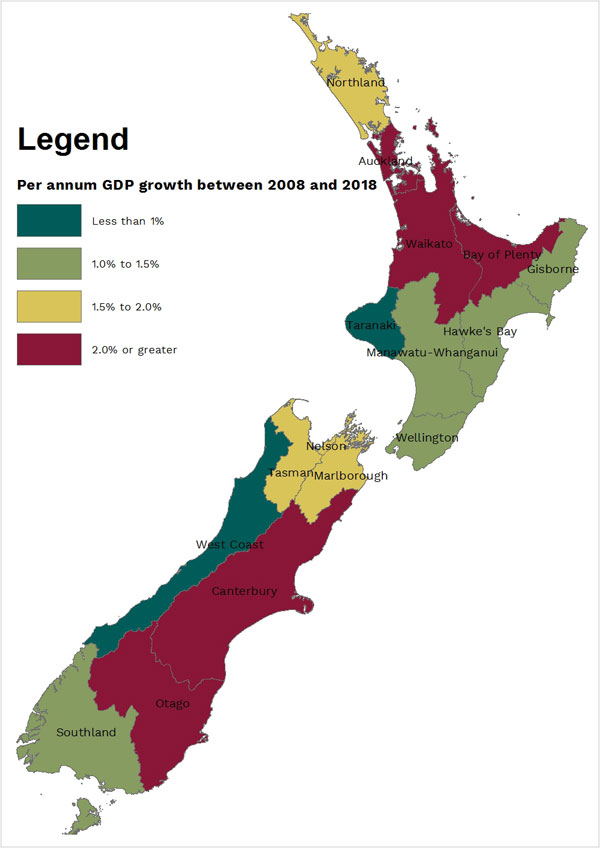
The largest per annum percentage increases have occurred in the Auckland region with the region growing over the last 10 years by 2.9 percent per annum. At the same time Canterbury has seen its GDP grow by just over two percent per annum over the last 10 years. At the other end the West Coast region (0.0 percent per annum), Taranaki region (0.0 percent per annum), and the Southland region (1.0 percent per annum) have seen much slower growth in GDP.
Moving away from per annum growth and examining the total percentage growth in GDP in each region reveals that a number of region grew faster in comparison to the overall New Zealand growth. These regions were Canterbury, Otago, Waikato, Bay or Plenty and Auckland. This is shown in the figure below.
05. Which industries have been fuelling this growth?
In terms of growth in GDP the top 10 industries driving our growth in GDP are shown in the table below. Six of the 10 industries are also amongst the top 10 in terms on employment growth, including the largest industry professional, scientific and technical services which have both the largest absolute growth in the employment along with GDP.
Overall the top 10 industries experienced 3.6 percent per annum growth in GDP across the last 10 years.
| Industry | GDP (2018$m) | ||
|---|---|---|---|
| 2008 | 2018 | %pa growth | |
| Professional, Scientific and Technical Services | 15,098 | 19,136 | 2.4 |
| Telecommunications Services | 5,015 | 8,233 | 5.1 |
| Construction Services | 7,663 | 10,584 | 3.3 |
| Agriculture | 9,424 | 12,197 | 2.6 |
| Other Store-Based Retailing | 5,877 | 8,201 | 3.4 |
| Hospitals | 5,662 | 7,833 | 3.3 |
| Road Transport | 4,398 | 6,383 | 3.8 |
| Computer System Design and Related Services | 2,578 | 4,546 | 5.8 |
| Public Administration | 5,908 | 7,748 | 2.7 |
| Food and Beverage Services | 3,689 | 5,371 | 3.7 |